Are you ready for the Big Data era?

Today we hear nothing but the word "data", data are everywhere, and everyone struggles to have them, a bit like what happened with the yeast for pizza during a certain pandemic that we all surely remember.
For the companies the data they acquire and manage are the greatest assets in their possession. "Data is the new oil!" someone would say.
Regardless of their sector and size, companies are faced daily with this reality and with an increasing amount of data. But what are the business data and why are they becoming increasingly important within the company?
It is necessary to setting the record straight and to specify that data have different value depending on whether to use them is a business figure rather than another. For example: managers, for whom business information is the starting point for making strategic decisions that involve the entire company. But also, the operating units use the data every day in their role, an example that we have touched closely with some of our customers can be the use of the data to perform the analysis of their production activity. The Gantt that follows, incorporated within the SolidRules MES, is one of the graphics that we usually use to efficiently schedule the activities of the production department.
The variability in the use and interpretation of data has, however, a seemingly intangible common point: the need to have concrete information to help different actors in the company to make informed decisions, and not based on the presentiment or favorable alignment of the planets. In this sense, information must be compared like any other corporate asset, without which it is not possible to easily carry out the business in everyday life. The crucial point is therefore to find such information, as well as the context in which data collection develops.
In other words, to facilitate the acquisition of information from company data, it is also necessary to consider the sources of origin of the same, which are divided into external sources and internal sources, the latter can in turn be composed of operational sources and Data Warehouse.
Where can we find the information?
Okay, now we know that data is important, but how do we find them and make them useful for our business purposes? Here the issue becomes spicy, and we tell you that there are several ways to find those infamous data.
Let’s start with operational sources. They refer to the daily operational activity of the company and, consequently, change and adapt according to its business. This remarkable specificity to the business reality that is analyzed, makes this type of source only partially superimposed on business contexts of different sectors. An example of operational sources related to an industry may include production management applications, purchase, order and delivery management applications, accounting and personnel management as well as customer management applications.
Data Warehouses are data management computer archives that collect all the data of an organization, and their aim is to represent the starting point on which to easily produce analyses and reports aimed at the decision-making and strategic processes of the company.
This organized collection of an enterprise’s information assets is guaranteed by that system of models, methods, processes, people and tools called Business Intelligence, especially analytics.
External sources of business data refer to data from outside, such as data from ISTAT surveys or sentiment analysis to understand the opinion of a target audience towards a specific topic, a product or service. In the latter case, social networks, blogs and online forums can be a source from which to find important information, even if data from this type of external sources may present some quality problems, understood as a lack of accuracy, consistency and/or completeness of the data.
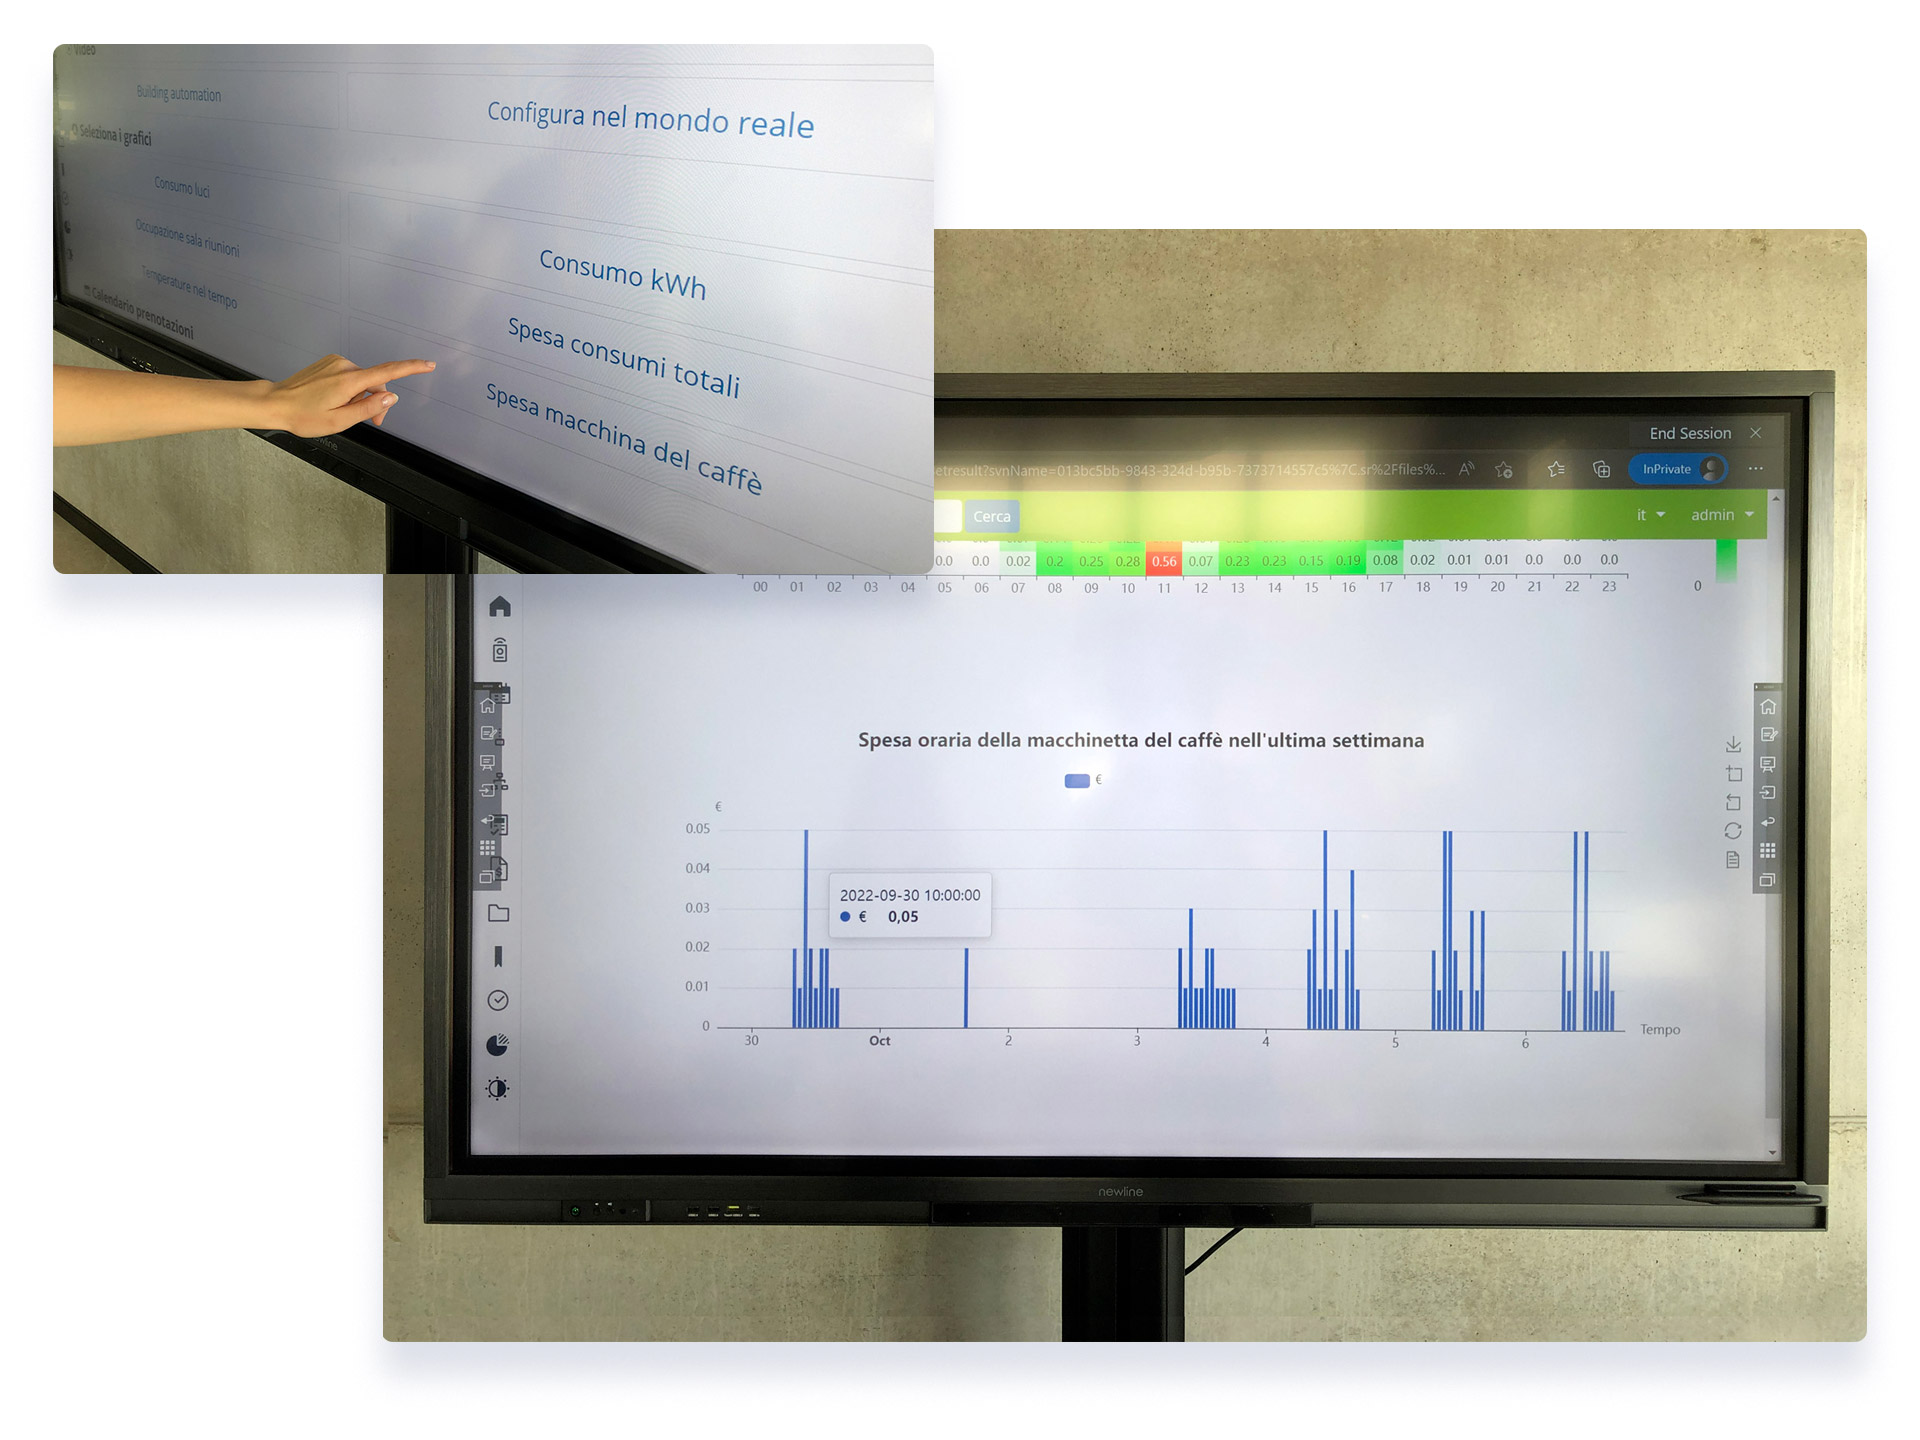
An example of internal sources can be seen below. You are looking at an important analysis by our Quantum on a vital topic in a software company. The consumption of the coffee machine, which, as you can see certainly not without wonder reaches its peaks on Monday morning. Who would have thought?
What are Big Data?
In an ever-changing world, the availability of more and more data from different sources results in so-called big data. The term big data is typically used to refer both to data that exceed the limits of traditional databases, and to technologies aimed at extracting new knowledge and value from them. In summary, you can define big data as the analysis of incredibly large amounts of information.
Big Data can be:
• Structured: data that can be processed, stored and recovered in a fixed format. It’s highly organized information that can be stored and easily accessed. Structured data is, for example, the information that a company keeps in its databases, such as tables and spreadsheets, where information is usually grouped into rows and columns. The business value that derives from them lies in how an organization can use its existing systems and processes for analysis.
• Unstructured: refers to unorganized data, lacking any specific form or structure. Unstructured data generally includes social media comments, tweets, shares, posts, audio, video... Unlike structured data, which is stored in Data Warehouses, unstructured data is usually entered into Data Lakes, which store the raw data format and all the information they contain.
• Semi-structured: they concern data containing both formats, that is structured and unstructured data. It refers to data that, although not classified in a particular repository, does contain vital information or tags that isolate individual elements within the data. Some examples of semi-structured data include XML and JSON.
The 6 “V” of Big Data
The main characteristics of big data are defined by the three "V" within the Doug Laney model (2001):
• Volume: refers to the volume of data, hence the amount of data available. As mentioned earlier, companies collect data from a large number of sources, including transactions, data from social media and information of various kinds.
• Speed: refers to the speed of data generation and transmission. They are now being transmitted at an unprecedented speed and must also be dealt with in a timely manner.
• Variety: among the experts says "More isn’t just more. More is different". The data have a heterogeneous nature and present many types of formats and extensions; they can be numerical and structured in the classic databases, unstructured text documents, documents, audio, e-mail and video. Not only transactional and business management systems, but also sensors, social networks, open data.
Today, in a world in continuous technological expansion, the model in question has been enriched by three other "V":
• Veracity: "Bad data is Worse than no data". Truthfulness must be understood as an intrinsic characteristic of the analyzed data. This is fundamental and deserves considerable consideration, otherwise you run the risk of using polluted data that, following the analysis process, returns unreliable and distorted information.
• Variability: the interpretation of the data may vary depending on the field in which it is collected and analyzed. The context from which the data is derived becomes relevant.
• Value: the ability to derive insights and therefore benefits. The wealth of information behind the data represents their value. It is important to know how to correctly transform data into value. In this regard, it is necessary to define clearly which elements characterise the data (data quality).
In view of the six "V’s", big data requires specific analytical technologies and methods that can lead to the extraction of values and information of rather relevant interest.
Why Big Data are important?
The importance of Big Data lies not in the amount of data you have, but in the use of these and in the ability to extract information from them. Big Data therefore means owning data from any source and analyzing it for many aspects such as: reducing costs, reducing time, product developments and targeted offers for customers and, proactively, making strategic decisions.
In other words, generating new knowledge is extremely useful for making more informed decisions in business and beyond. Big Data have an impact in all processes: from the efficiency of production processes to the management of customers and communication with them, to the management of flows and contingencies, which could result in emergencies to be resolved promptly.
In the chart below, for example, you can see a heat map showing the overall effort for each business resource. This allows you to instantly understand whether resources are being over-allocated.
The system measures the allocation considering the estimated hours to completion compared with those available (according to the company calendar rather than meetings, holidays, interventions).
This is important to assess the efficiency of the organization of business processes.
I Big Data and Business Intelligence
Business intelligence is aimed at descriptive analytics that represents the first level of advanced data analysis. In particular, descriptive statistics are used to analyze, measure and evaluate information, using clean, limited and, in general, corrected datasets from all those anomalies that could be obtained during data collection. In this way a present or past photograph is obtained, that is a detailed and rather faithful representation of the examined reality, to favor the decisional process. In summary, it prioritizes the summary of historical and current data, to show past or current events, answering the question "what" and "how".
Big Data instead uses inferential statistics and nonlinear systems identification concepts to analyze regressions, causal effects, and relationships from huge data sets. In addition, they rely on complex predictive models and heterogeneous datasets unrelated to each other, to emphasize the relationships and dependencies of this data, with subsequent predictive analyses as accurate and accurate as possible.
Business Intelligence and OLAP cube
One of the key components within Business Intelligence is the OLAP cube, also called as hypercube, when referring to three or more dimensions to analyze and organize data.
In other words, the term OLAP (On-Line Analytical Processing, literally translated as "online analysis process"), refers to an approach used to execute queries involving multiple dimensions, allowing a much faster response than a transactional database query. The multidimensionality made available by the OLAP methodology is one of the main strengths and represents a good compromise between the Data Warehouse and the end user, providing the latter an intuitive, simple, interactive, and highly performing to analyze large amounts of data. In summary, the main advantages of an OLAP cube are:
• Performance, speed in the execution of queries showing updated and aggregated data in a short time.
• Multidimensionality, or analysis on two or more dimensions.
• Easy to use, without making complex calculations and calculations. The usability for the user is simple and does not require any prior technical knowledge.
• Analysis detail, possibility of data representation with a different level of analysis, from the maximum aggregation to the most meticulous retail.
All these characteristics induce the OLAP to be used by companies for the analysis of sales results and marketing campaigns, for the management of production, for the assessment of the evolution of costs and revenues and other operations essential to the daily activities of the company. It is therefore a Business Intelligence tool that aims to use the information obtained to support business decisions, through typical reporting and data visualization tools. What if we wanted to go beyond the mere reading of data that guide decisions? Are there tools that allow us, for example, to collect, study and analyze information in real time, predicting future behaviours and trends?
In the screenshot below you can see an example of OLAP that summarizes some more relevant information about ticket management through the use of some KPIs (Key Performance Indicators) considered important that must be consulted immediately to understand if you are in line with the achievement of business objectives.
Le Big Data Analytics
Big Data cannot be analyzed with the traditional Relational Database Management System (RDBMS), since the latter are not able to manage the storage and analysis in speed. Just think of data from the Internet, social networks, IoT devices (Internet of Things) and the industrial Internet of Things (IIoT). The data sources are many and constantly increasing; therefore, what characterizes big data is not only the quantity, but also the complexity.
To make a Big Data Analytics is good to follow a series of steps that start with the acquisition and understanding of data, go through modelling and prediction, up to the ability to make decisions, acting appropriately, and by monitoring the results of empirical evidence.
Companies typically use advanced analytics techniques to analyze big data, such as text analytics, machine learning, predictive analytics, sentiment analysis, data/text mining (data cleanup, data transformation and data management systems creation), modelling and machine learning, to determine likely future results in order to make more informed decisions. It answers the question "why", giving the possibility to anticipate what with a certain degree of confidence could happen, thus adopting in advance the most appropriate changes and solutions, so that a positive result can be achieved.
In general, advanced analytics techniques that impact all business processes can be classified into macro categories:
• Descriptive Analytics (descriptive analysis): answers the question "What happened?". Specifically, statistical analysis techniques are used to divide raw data into a form that allows applying models, identifying anomalies, improving planning and comparing compatible objects. Companies get the maximum value from descriptive analysis when they use it to compare elements over time or with each other, whose representations take place through appropriate graphs.
• Diagnostic Analytics (diagnostic analysis): answers the question "Why did it happen?" and is characterized by techniques such as drill-down, data discovery, data mining, correlations, probability theory, regression analysis, clustering analysis, filtering and time series analysis. It’s not just statistics, though. It involves developing lateral thinking, as well as considering internal/external factors that could affect data collection within the models used. In fact, its main objective is to identify and explain anomalies and anomalous values.
• Predictive Analytics (predictive analytics): answers the question "What might happen in the future?" and represent the second level of advanced data analysis. Predictive analytics, using mathematical models/ forecasting and machine learning techniques, use data to make a useful analysis to extrapolate possible future scenarios, anticipating what might happen.
• Prescriptive Analytics (prescriptive analysis): answers the question "What should we do next?". The pivotal point of this type of analysis is the association between data analysis and decision making. Descriptive analysis and predictive analysis, together with more complex mathematical models and analysis systems, allow to derive timely and useful information that favor operational and strategic solutions. In this way, more accurate and objective data-driven decisions can be made, moving from "prediction" to "action".
• Automated Analytics (automated analysis): when we talk about automation, we refer to solutions capable of implementing the proposed "action" independently according to the results obtained from the analyses that have been carried out. Automation in data analysis is particularly useful when analyzing big data and can be used for multiple tasks, such as data identification, data preparation, dashboard creation, and specific reports.
Innovate to grow the company: a new competitive advantage offered by Big Data
The use of Big Data is becoming a crucial strategy for companies to overcome their competitors. The resulting competitive advantage refers to the use of increasing amounts of information, through algorithms capable of dealing with many variables in a short time and with reduced computational resources. It is no coincidence that Big Data supports the collection, classification, analysis, and synthesis of data of a given sector, giving the possibility to derive important information. The real revolution of Big Data is therefore in the ability to use large amounts of information to process, analyze and find objective feedback on different issues of everyday business in multiple business markets.
The secret is not just to collect large amounts of data but to be able to analyze them correctly so that they can best express their potential. In this sense it is important to promote the culture of data, because in order to be really useful to companies for their business objectives, it is necessary to define not only a data collection plan, but a system of technologies and specific skills that allows you to extract from them the value they contain.
The correct extraction of their value implies a coherent and integrated strategy for their management, which allows reliable data to be obtained when decisions based on numbers have to be made, otherwise you would run the risk of implementing business actions based on wrong empirical evidence, with huge losses of time in the search for mistakes made.
What can really make a difference today is the speed of reaction to changes, promptly adapting their business actions to the evolving reality, to aim for their competitive advantage. All companies, through a rapid data analysis, in real time, can be able to put in place specific and winning strategies, in advance of competitors. The performing company will be the one that will promote the data culture in every department, managing to extract the maximum value from an analysis that is faster, more intuitive and faster.
Start your digital transformation with SolidRules Quantum
All the graphs that we showed you in this article were made with SolidRules Quantum.
Quantum combines the digital transformation of companies with the most advanced analysis techniques in the fields of Artificial Intelligence, Internet of Things (iot), Machine Learning, Deep Learning and Big Data.
The ways in which we are using it internally are many and we continue to experience new ones.
In addition to smart buildings of which we have already talked in a previous article, we also use Quantum within the production, where it offers a factory management system 4.0, allows you to monitor the real-time data of all machines, to correlate these data with those on SolidRules Desk, analyzing all possible information and emphasizing all possible criticalities and/or opportunities, through its own Business Intelligence tools.
Obviously, this is just a small entrée of everything you can expect from Quantum but especially from our Research and Development department that found in it its playground. If you want to know more about the topic, visit the Quantum page.
Más de Alexide
Are you ready for the Big Data era?
Data ManagementWhich product configurator to choose?
Product configurator¿Alguna pregunta? Estamos aquí para ayudarte.
Rellena el formulario o envíanos un correo electrónico a info@solidrules.com. Nos pondremos en contacto contigo para ofrecerte todas las soluciones.


